ProxonProxon

Agent Observer for Node.js.

Install it, launch your app with one flag, and every LLM call your process makes reports its cost and token usage into Proxon — with zero call-site changes. It instruments the Anthropic and OpenAI SDKs in place, so you slice spend by agent, task, and owner without touching a single request. It is fire-and-forget: it never throws into or slows your request path, and it never sees prompt or response content — only token counts and metadata.

Set it up

Three steps, about a minute. You'll mint a workspace credential, install the package and launch your app with the register flag, and confirm the cost lands in Cost Intelligence. You need to be a workspace owner or admin to mint the credential; anyone can wire the SDK once they have it.

01

Mint a service credential

In Proxon, open Settings → Service Credentials (under the Organization group) and choose Generate. Proxon issues a bearer token that starts with prx_svc_, scoped to your workspace.

The token is shown once — copy it and store it as a secret (an environment variable or your secrets manager). Proxon keeps only a hash, so it can’t show it to you again; if you lose it, rotate or generate a new one. You can revoke or rotate a credential from the same screen at any time.

Only workspace owners and admins see Service Credentials. If you don’t, ask an admin to mint one for you.
02

Install and launch with the register flag

Add the package to your Node app (Node ≥ 18.19 — CI, containers, servers, or a laptop):

install
npm i @proxon/agent-observer

Point it at Proxon with the three PROXON_OBSERVER_* environment variables. Swap prx_svc_<prefix>_<secret> for the token from Step 1.

shell
# Where to send agent-cost events (Proxon's production ingest host).
export PROXON_OBSERVER_INGEST_URL="https://ingest.proxon.ai"

# Authenticate with the service credential you minted in Step 1.
export PROXON_OBSERVER_SERVICE_CREDENTIAL="prx_svc_<prefix>_<secret>"

# Name the agent this process reports as (the rollup keys on it).
export PROXON_OBSERVER_AGENT="my-agent"

Then launch your app with the register flag — no source edits. It patches the Anthropic and OpenAI SDKs at module load:

launch
node --import @proxon/agent-observer/register app.js

--import auto-instrumentation is ESM-only. A CommonJS app (or when you construct the client yourself) instruments the instance explicitly with wrap(new Anthropic()) instead. @anthropic-ai/sdk and openai are optional peer dependencies — the SDK instruments whichever you already depend on.

03

Confirm it landed

At startup the register entry logs one confirmation banner to your process logs, so you can verify it loaded:

startup log
[proxon-agent-observer] active — reporting agent-cost to https://ingest.proxon.ai as agent "my-agent"

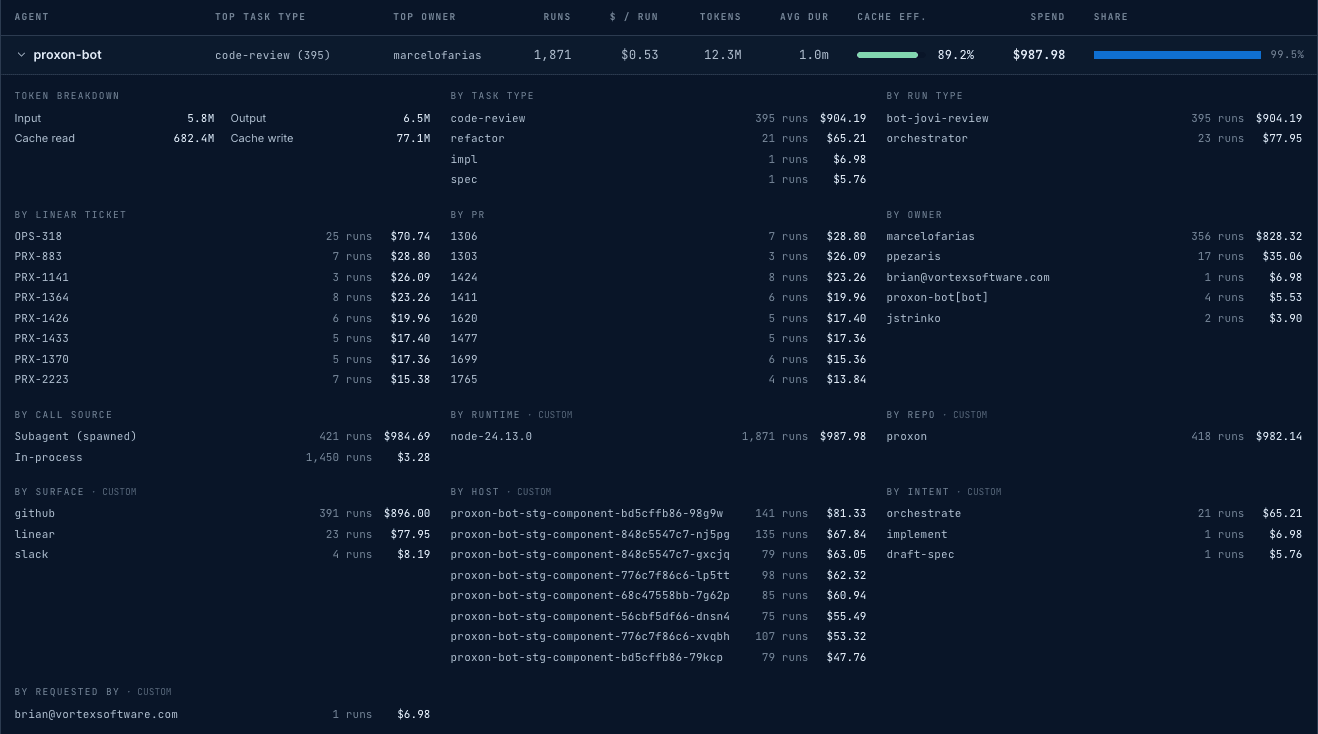
Turn on the Proxon SDK for Agents in Settings → Data Collection so Proxon shows the Agent Cost view, then open Cost Intelligence. Your agent’s spend appears there, broken down by model and by the agent name you set — usually within a minute of the first flush.

Proxon Cost Intelligence: one agent's spend broken down by task type, run type, owner, Linear ticket, PR, and custom attributes like repo, surface, host, and intent.
Cost Intelligence auto-attributes an agent's spend across the fixed fields and every custom attribute you supply — no schema setup.

Providers return token counts, not dollars; Proxon recomputes cost server-side from a maintained price book, so you never ship pricing in your agent. Content — prompts and responses — is never sent.

Going further — attribute by agent / task / customer

The instrumentation can’t know what a given call is for — that’s business context you supply. Wrap a unit of work in withContext and every event emitted inside it inherits the attribution. Fixed fields — agent, task_type, run_type, owner, linear_ticket, and pr_number — become first-class dashboard dimensions; anything in the open-ended attributes bag is auto-discovered as its own breakdown, so a couple of extra keys give you a by-tenant, by-feature, or by-environment view for free.

attribute your spend
import { withContext, flush } from '@proxon/agent-observer';

await withContext(
  {
    // Fixed fields — first-class dashboard dimensions.
    agent: 'support-bot',
    task_type: 'triage',
    run_type: 'orchestrator',
    owner: 'octocat',
    linear_ticket: 'PROJ-42',
    pr_number: 128,
    // Open-ended custom dimensions — attach whatever your business cares
    // about; each key becomes its own breakdown, no schema change needed.
    attributes: { tenant: 'acme', feature: 'search', environment: 'prod' },
  },
  async () => {
    await anthropic.messages.create({ /* ... */ }); // auto-attributed
  }
);

await flush(); // ship the final batch on shutdown / after a one-shot run
Agent Observer or OpenTelemetry?

The Agent Observer and OpenTelemetry do the same job two ways. For a Node app you control, the Node.js Agent Observer on this page auto-instruments it with one line. For anything else — another language, or a tool that already emits OpenTelemetry like Claude Code or GitHub Copilot — point that exporter at Proxon’s OTLP endpoint instead. Either is enough on its own; running both adds detail, not new coverage. See how Proxon collects data for the full picture.