
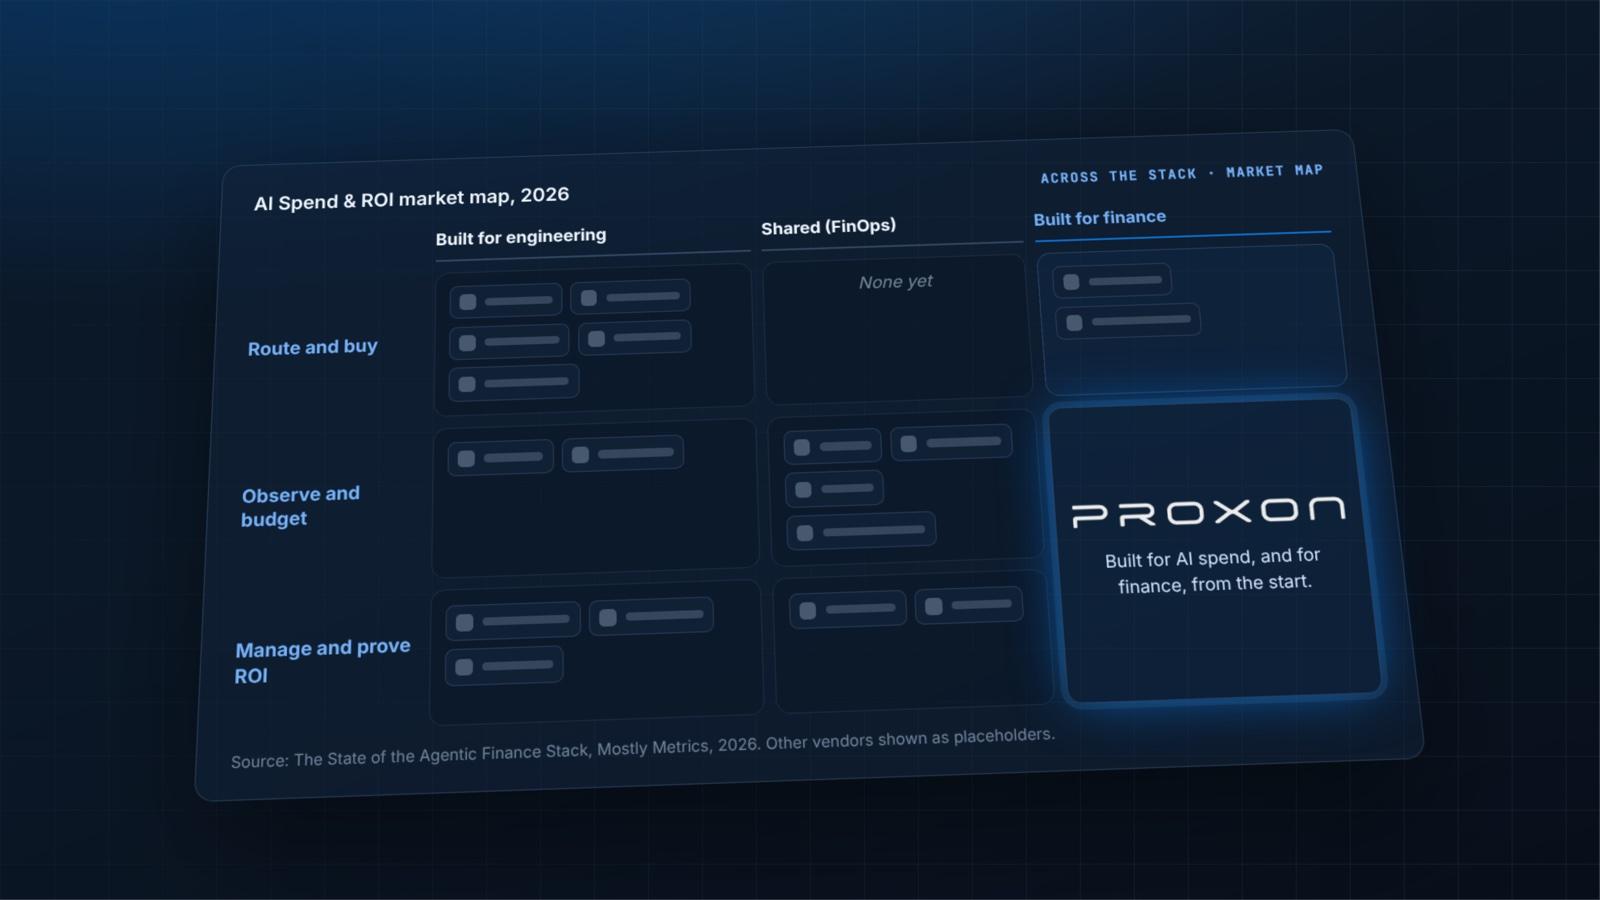
The AI Spend & ROI market map groups tools that help a company see what it spends on AI and what it gets back. Columns show who each product was built for (engineering, shared FinOps, or finance). Rows show the job: route and buy, observe and budget, or manage and prove ROI. It is a map, not a leaderboard.
If you're a CFO right now, you probably have an AI budget, an AI mandate, and one question you can't quite answer: what did we spend on AI last month, and what did we get for it?
You are far from alone. In a survey from Avalara, 92% of CFOs and senior finance staff said they feel pressure to show AI ROI (CFO Dive). IBM's research found more than 6 in 10 CFOs now say their role covers AI strategy (CFO Dive). So the work has landed on your desk, and your team's, whether or not anyone planned for it.
I think that's good news. This is the moment finance gets to shape how a company adopts AI instead of finding out about it from the invoices. And for the first time there's a map of the tools built to help.
The Agentic Finance Stack Report goes live today from Mostly Media. It's their second annual edition, and this year it adds AI Spend & ROI as its own category, next to core accounting, FP&A, close, tax, AP and the rest. Proxon is on that map, so I'll be upfront about that. I'll also tell you how I'd read it if I were sitting in your chair, and I'll point to what CFOs themselves have been saying about all of this on public earnings calls. My teammate Jordan pulled that research together, and it shaped almost everything below.
How to Read Any Map in the Report
The report opens its map section with a page called "How to Read Market Maps," and the first line is the one I'd pin to the wall: this is a map, not a leaderboard. Three things follow from that.
Logos are listed alphabetically inside each box, so where a logo sits within a box means nothing. Placements reflect what a product can do as of November 2026, which is different from how most customers actually use it. And being further along a map describes how a product works, not whether it's any good.
That last point matters for you. A map can tell you what exists and how it's built. It can't tell you whether it fits your stack, your team, or your data. That part is still your diligence.
How to Read the AI Spend & ROI Map Specifically
Most maps in the report run Deterministic to AI-Assisted to Agentic, left to right. This one is different, because AI Spend & ROI is a new category and it's organized around a different question.
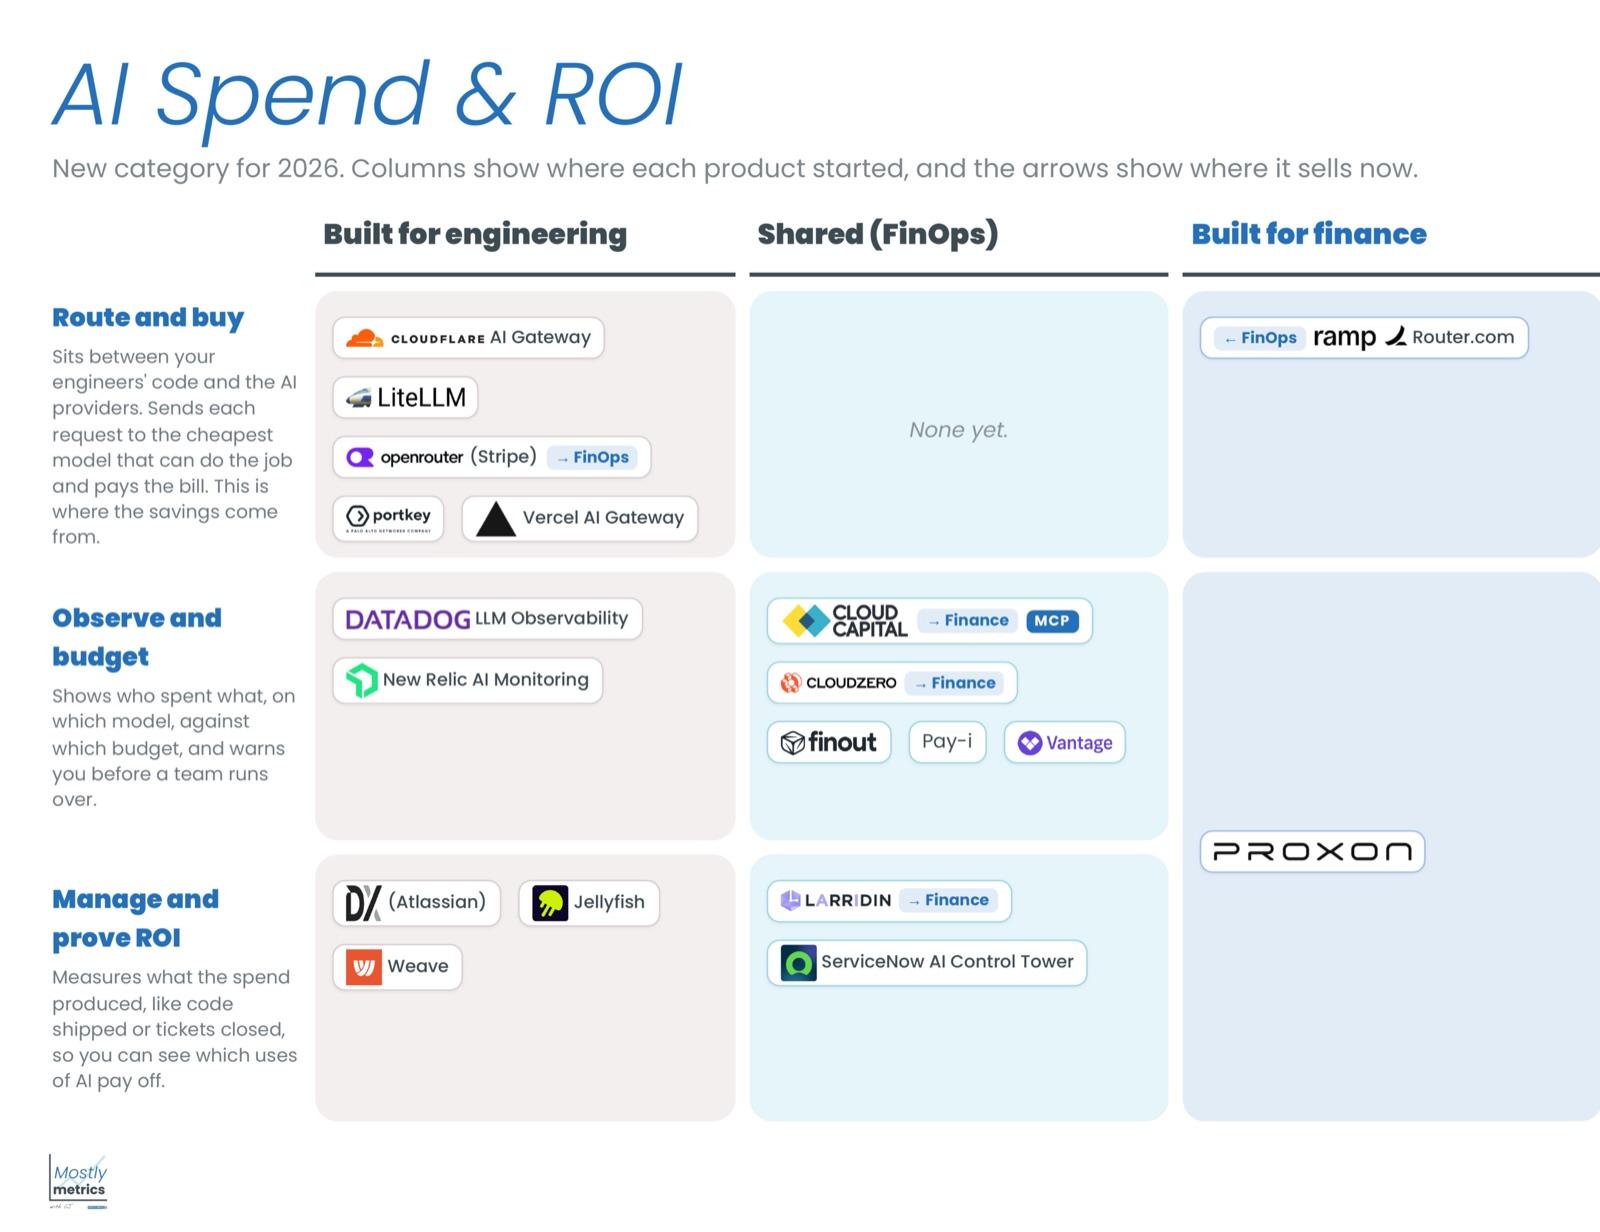
The columns tell you who each product was built for. The report groups them as built for engineering, shared (FinOps), and built for finance, with small arrows showing where a product sells now. That's useful, because the person who built the tool shaped what it can see. Engineering-built tools are strongest on the API traffic that runs through code. Finance-built tools start from the budget, the contract, and the question of who's accountable for the number.
The rows are a ladder. Reading from the top:
| Row | What the tools do | The question it answers for finance |
|---|---|---|
| Route and buy | Sit between your engineers' code and the AI providers and send each request to the cheapest model that can do the job. This is where savings come from. | Are we paying the lowest price for the work we're running? |
| Observe and budget | Show who spent what, on which model, against which budget, and warn you before a team runs over. | Where is the money going, and who owns it? |
| Manage and prove ROI | Measure what the spend produced, like code shipped or tickets closed, so you can see which uses of AI pay off. | Which uses of AI are worth it, and what do we do next? |
Here's how I'd use that ladder. Routing makes the bill smaller. Observing makes the bill visible. Proving ROI makes the bill defensible. Most teams I talk to need all three eventually, but they usually need the middle one first, because you can't route, budget or prove anything you can't see. The report puts it in the same order: see the spend, then control it, then optimize it.
Two more things stood out to me when I looked at the map as a finance person.
First, the report notes that engineering and finance tools are converging. If your engineers already route through one tool, the useful question for your team is what spend reporting finance can get out of it. The report ties this back to cloud: when cloud bills took off, finance got its own cost tools, and AI is the same problem moving faster.
Second, the built-for-finance column has the fewest logos. I wouldn't read that as a verdict on anyone. I read it as a sign the category is early, and early is a good time to decide what you want before you're locked into what someone else built.
Proxon sits in the built-for-finance column, across the observe-and-budget and manage-and-prove-ROI rows. That's where we chose to build, because finance is the team that has to answer for the number. As the report itself says, placement says nothing about whether a product is good, so please hold us to the same questions as everyone else.
What It Means for the CFO
I want to separate what the report says from what I'm adding. The report describes the category. What follows comes from Jordan's research, which looked at what CFOs said on public earnings calls about AI, margins and spend. Where the exact words matter, I'm quoting them. Where a CFO said something adjacent to an idea rather than the idea itself, I'm saying so.
1. The margin story is the optimistic one, and it needs verifying. Cognizant's CFO described "sequential gross margin expansion, driven by better utilization and AI-led productivity." IBM's CFO talked about "gross margin expansion and operating leverage." Those are two companies describing AI-linked productivity showing up in margin, alongside other drivers like pricing and mix. The report puts the stakes in plain terms for software companies: as AI moves into cost of revenue, the difference between a 30% gross margin business and a 50% or 60% one is huge. The question Jordan built the research around is the one I'd start with too: can you see which AI workflows are expanding margins, which are merely increasing activity, and which are consuming the savings they create?
2. Visibility is a CFO-level topic now. Microsoft's CFO talked about the "observability of token spend and the manageability of token spend" as part of how the company thinks about returns. You don't need to run a hyperscaler to want the same two things: to see token spend, and to be able to manage it.
3. Cheaper tokens don't automatically mean a smaller bill. Uber's CFO has described lower token costs with AI spending broadly stable while adoption rises. The report says something similar from the buyer's side: cheaper models rarely shrink the bill, because teams move old work to cheaper models and spend the savings on new work with the expensive ones. That's not a problem. It's usually a sign people are building more. But it means cost per token is the wrong number to stop at. The better one is the fully loaded cost of a useful outcome, and whether it's falling as usage grows.
4. The benefits are real, and many aren't visible in earnings yet. JPMorgan's CFO said on an October call that "the benefits aren't observable in our current quarterly earnings." I find that more encouraging than discouraging. It says the best-resourced finance teams in the world are at the same starting line, and the gap is measurement. Closing a measurement gap is a project finance knows how to run.
5. Someone has to own the outcome. IBM's CFO put it simply: "We have to have a framework to manage and govern this explosion of GenAI." The Avalara survey found 23% of finance leaders said no one, or that it's unclear who, would answer for an AI error. Pez said it well in the report's conclusion: when we hand important decisions to AI, someone still has to own the outcome, and we need to know who before something goes wrong.
| What CFOs are saying | Where it comes from | The question for your team |
|---|---|---|
| AI-led productivity is showing up in gross margin, alongside pricing and mix | Cognizant and IBM CFOs (quotes) | Which AI workflows expand margin, and which just add activity? |
| Token spend needs to be observable and manageable | Microsoft CFO (quote) | Can finance see and manage token spend by team and workflow? |
| Lower token costs, with total AI spend broadly stable as adoption rises | Uber CFO (paraphrase) | Is the cost of a useful outcome falling as usage grows? |
| Benefits aren't yet observable in quarterly earnings | JPMorgan CFO (quote) | When do operating gains show up in earnings, and what offsets them? |
| We need a framework to manage and govern this | IBM CFO (quote) | Who owns each AI line, and what happens when an agent gets it wrong? |
What It Means for Your FP&A Team
In the conversations I've been part of, the CFO is usually the one who buys, and the person who lives with the answer every week is on FP&A. They forecast, track budgets, and bring the summary to the CFO or VP of Finance. So here's the practical read for them.
The report quotes Julio Martinez of Abacum on how to treat this spend: "A lot of companies still book AI as a software line. It behaves more like headcount. You plan it by team, against the output you expect, and you revisit it every month when the actuals land." I'd print that and hand it out.
In practice, that looks like this:
- Plan AI by team and by outcome, not as one line in software.
- Split cost of revenue from operating expense. Where AI sits in the P&L changes what it does to margin, and a lot of tools can't split it.
- Count the seats, too. The report describes a CFO who found five people on one team on premium plans while the company-wide pool ran 45% over for the month. The API bill is only part of the picture.
- Set the guardrails early. The report's best example is a company where a single experiment spent $400,000 on tokens in three days before anyone noticed. Alerts and caps are the finance version of good brakes, and good brakes are what let a team drive fast.
Five Questions to Ask Before You Sign
The report's AI Spend & ROI page ends with five questions I'd bring to any vendor, including us:
- Does it see every AI bill, including seats and add-ons, or only the API traffic it routes?
- Can it split AI spend between COGS and OpEx?
- Can it cut off a runaway experiment before it turns into a $400,000 bill?
- Can it show me AI cost per customer, or per product?
- Do I keep my usage history if we switch tools?
And four questions from Jordan's research I'd bring to your own team, because they don't depend on any vendor:
- How much margin improvement can we attribute to AI, separately from pricing, mix and utilization?
- Are productivity gains becoming lower expenses, additional capacity, or new revenue?
- Can finance see which workflows generate AI cost, and control it without slowing down useful adoption?
- What return does an AI investment have to show before we increase its budget?
Where I'd Start This Month
You don't need a six-month program. Pick one month, gather the invoices from every AI vendor plus the AI add-ons inside your other software contracts, and split them by team. That alone usually surprises people. Then choose one workflow and write down the outcome it's supposed to produce. You now have the beginning of a cost-per-outcome number, which is the number your board will eventually ask for.
Then read the report. It has the full map, a plain-English overview page for every finance category, and the questions to ask before you sign in each one. I'm grateful to CJ Gustafson and the Mostly Media team for building it, and to Jordan for the CFO research behind this post.
If you'd like to see how Proxon approaches AI spend and ROI for finance teams, take a look here: https://proxon.ai/finance.
FAQ
What is AI Spend & ROI?
Software that tells a company what it spends on AI, who is spending it, and whether it is worth it. It covers API bills from model providers plus the AI seats and add-ons inside other software contracts.
How do I read the AI Spend & ROI market map?
Read the columns as who each product was built for, and the rows as a ladder: route and buy, then observe and budget, then manage and prove ROI. Logo position inside a box means nothing, and placement says nothing about quality.
Who should own AI spend, the CFO or the CTO?
It varies by company, and the CTO usually can't carry it alone because AI cost shows up in every department. Engineering decides which models are worth it. Finance meters and manages what the company spends and decides how much AI spend is worth it.
What is the difference between routing, observing and proving ROI?
Routing sends each request to the cheapest model that can do the job. Observing shows who spent what, on which model, against which budget. Proving ROI measures what the spend produced, such as code shipped or tickets closed.
Why doesn't a cheaper model always lower the AI bill?
Teams often move old work to cheaper models and spend the savings on new work with the expensive ones. Cost per token can fall while total spend holds steady or grows, so track the cost of a useful outcome too.
What should finance ask before buying an AI spend tool?
Whether it sees every AI bill including seats and add-ons, whether it splits COGS from OpEx, whether it can stop a runaway experiment, whether it shows cost per customer or product, and whether you keep your usage history if you switch.
About Proxon
Proxon helps finance and engineering leaders see what their company spends on AI, who is using it, and what it produces.
Related Reading
- How AI-Blind Is Your Company?
- The State of the Agentic Financial Stack, Mostly Media
- AI Spend & ROI for finance
- Proxon Cost Intelligence
About the author

Brianna Valleskey is VP of Marketing at Proxon, where she leads positioning and demand. She has spent more than 10 years in B2B SaaS marketing, as an early marketing hire at LevelEleven, Sendoso and Inscribe, and started her career at Benzinga's live day trading radio show. She writes about how finance and engineering leaders can see what their AI spend delivers.
Research referenced in this post.
- The State of the Agentic Financial Stack — Mostly Media, Nov 17, 2026
- 92% of CFOs, top finance staff feel pressure to show AI ROI (Avalara) — CFO Dive
- More than 6 in 10 CFOs expand AI and tech strategy (IBM) — CFO Dive
- CFO Interview Terms for AI Adoption — Proxon research (Jordan) on CFO earnings-call language, updated Oct 22, 2026
- How AI-Blind Is Your Company? — Companion post by Pez, Nov 17, 2026