

Confirming data is flowing
Check that people are connected and sending data after a rollout, and find anyone who needs help.
After you deploy, confirm that people are connected and sending data, and find anyone whose observers are not reporting yet. Proxon gives you a live view of this, and a filtered list of the exact people to follow up with.
The Live on Proxon view
You see this view as the last step of admin onboarding, and at any time at the top of Org Settings, Data Collection. It shows your organization coming online in real time.
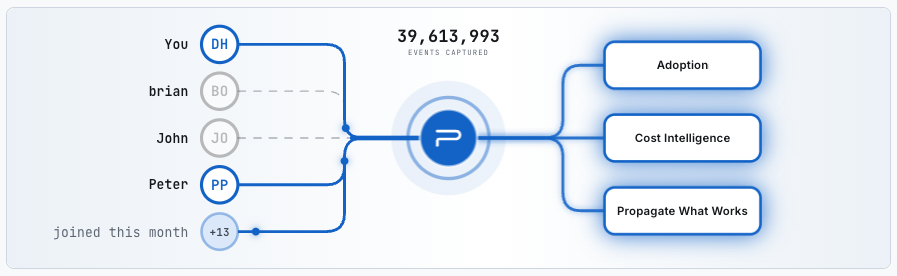
Each person appears as a line into Proxon. A solid, flowing line means they are connected and sending data. A faded line means that person is not sending data yet. The view also shows a running total of events captured, and from Proxon the lines flow out to the places the data feeds: Adoption, Cost Intelligence, and Propagate What Works.
At the bottom, the view tells you how many people have not set up capture yet, with a See details link. That link is the fastest way to the exact people who need help.
Find who needs help
The See details link opens Org Settings, Members, filtered to the people with observer issues. You can also open Members directly and apply the same filter. The page lists everyone with a Proxon login, along with their role, their observer reporting status, and any pending invitations.
Three tabs narrow the list:
- All shows everyone.
- Observer issues shows only the people whose observers are not reporting as expected. These are the people to follow up with.
- No devices shows the people who have no observers at all.
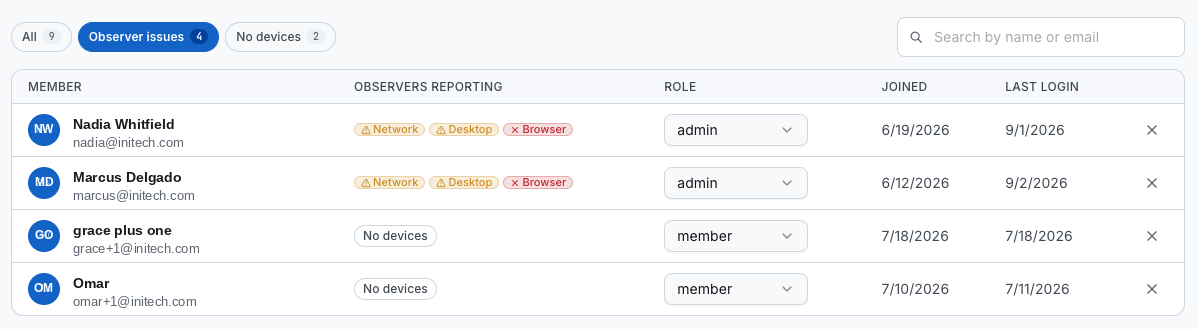
Reading the observer status
Each person's row shows their observers under Observers reporting, with a separate lozenge for Browser, Desktop, and Network. The state reflects activity in the last 7 days:
| Lozenge | Meaning |
|---|---|
| Green | The observer has sent activity within the last 7 days. |
| Orange | The observer has sent no activity in the last 7 days. |
| Red | The observer has never been installed and has never reported in. |
| No devices | The person has no observers at all. |
A single person can show a mix, for example a Browser observer reporting while Desktop and Network show orange. Treat orange as an observer that has gone quiet and is worth a check, and red as one that was never set up and needs installing.
What to do next
For someone with a red observer or No devices, walk them through installing it. A single machine uses the manual install, and a fleet uses the managed deployment for macOS or Windows. For an observer that has gone orange, confirm the person's machine is on and the observer is still installed, then check again after it has had a chance to report.